SENTINEL. Monitor facility performance to ensure instruments, applications, and staff are working together efficiently.
Dashboard
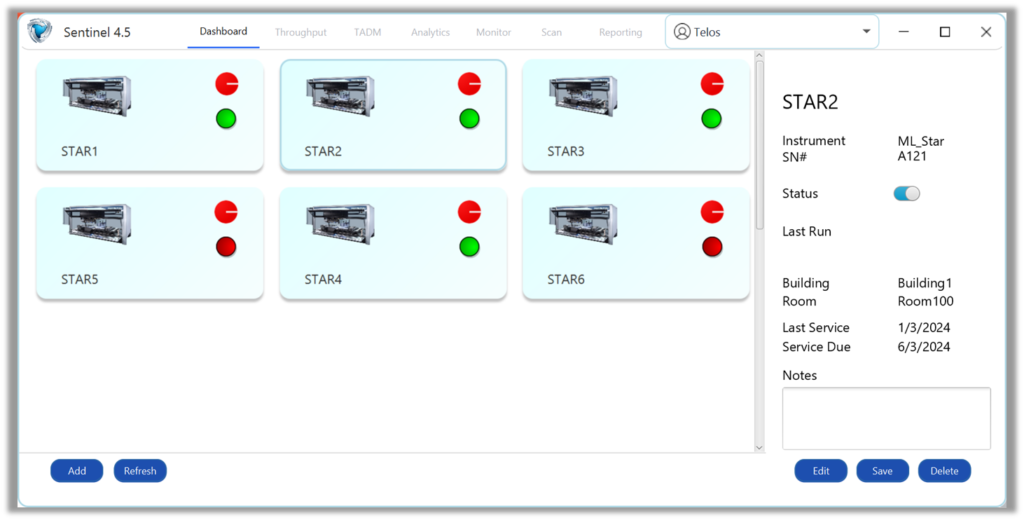
Use the Dashboard as a central hub where staff can view current details about each instrument. See instrument status and recent activity in real time. Share critical observations between individuals and shifts.
Sample Confirmation
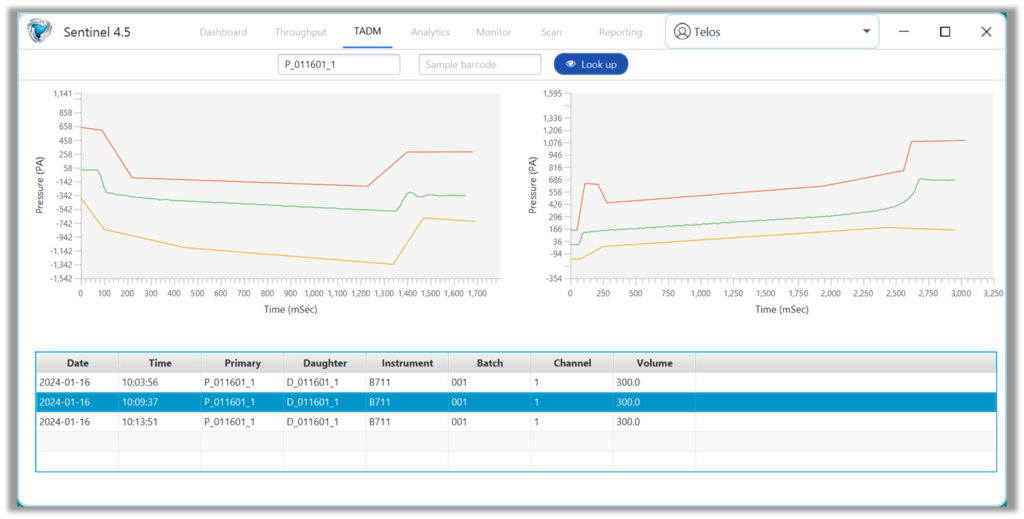
Sample processing confirmation. Use your sample barcodes to retrieve a list of all associated runs. Select the run of interest to view your sample details including TADM results, Date, Time, Instrument, Batch, Pipetting Channel involved, and the Volume that was transferred.
Throughput Analytics
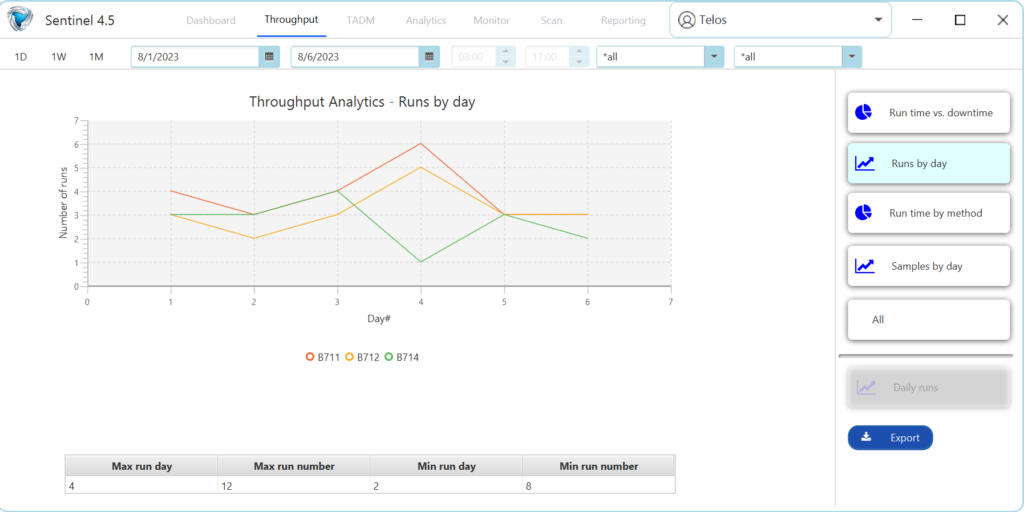
Perform analytics on instrument usage.
Graphically visualize how and when instruments are used to identify opportunities to increase lab efficiency. Create actionable reports, identify trends, monitor usage, and track key business metrics
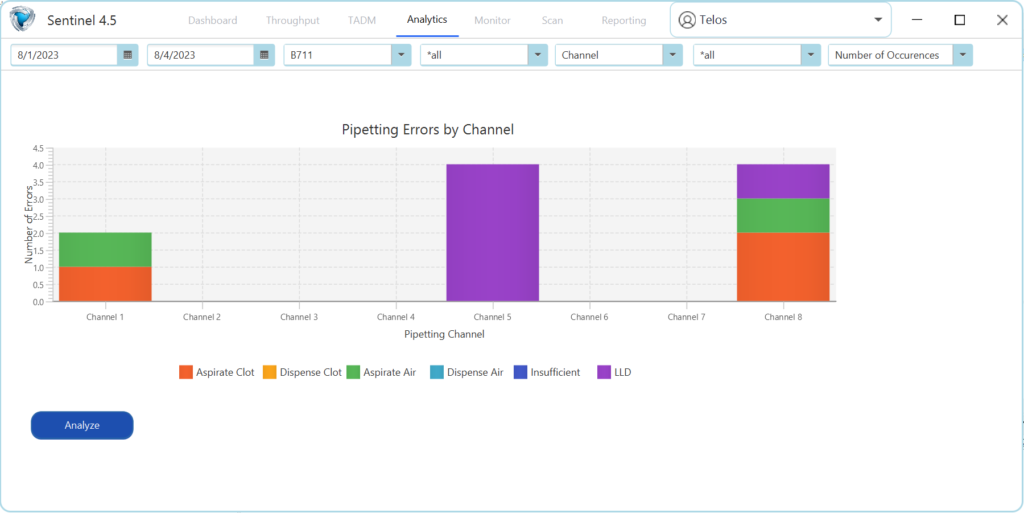
Hardware Error Analytics
Identify hardware issues in advance to avoid costly losses of time and data! Sentinel will perform analysis on hardware errors for each run in order to detect anomalies. Identifying hardware problems early allows issues to be serviced before complete failure. Run specific analysis of errors helps to identify the cause and streamline the solution.